Vessel Performance Monitoring Software: Turning Data Into Action
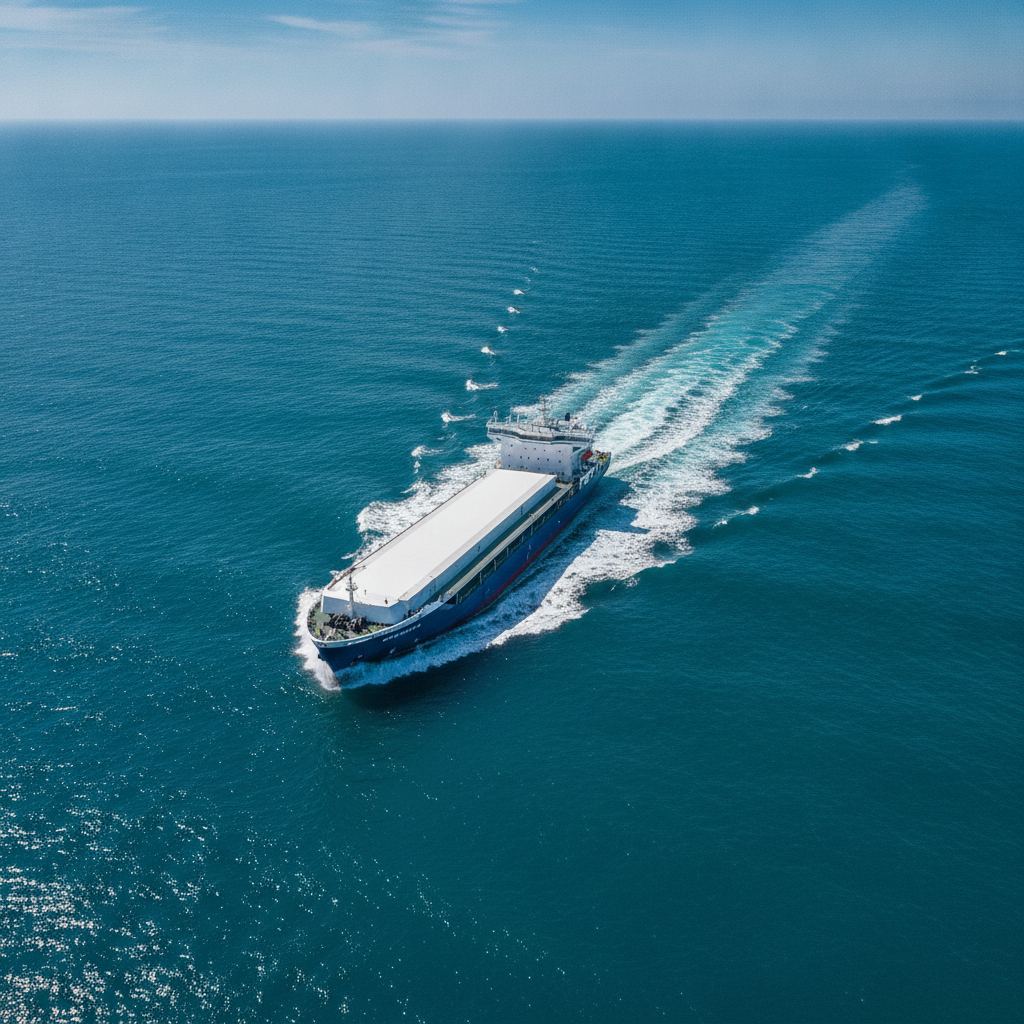
Every ship is a moving, ageing, weather-exposed machine whose efficiency drifts a little every day. Hulls foul, propellers roughen, engines lose tune, and the gap between how a vessel should perform and how it actually performs widens quietly until it shows up as a larger fuel bill or a worse carbon rating. Vessel performance monitoring software exists to close that gap. It collects operational and technical data, normalises it for conditions, and tells fleet and technical teams exactly where energy and money are being lost and what to do about it.
For commercial operators the stakes are no longer just commercial. Fuel is typically the single largest operating cost for a vessel, and it is now also the input to a growing stack of regulation. Ship performance monitoring has moved from a nice-to-have engineering tool to the operational backbone of both cost control and compliance. This article explains what the software does, the data behind it, the analyses that matter, how performance connects to regulation, and how to turn insight into measurable savings.
What Vessel Performance Monitoring Software Actually Does
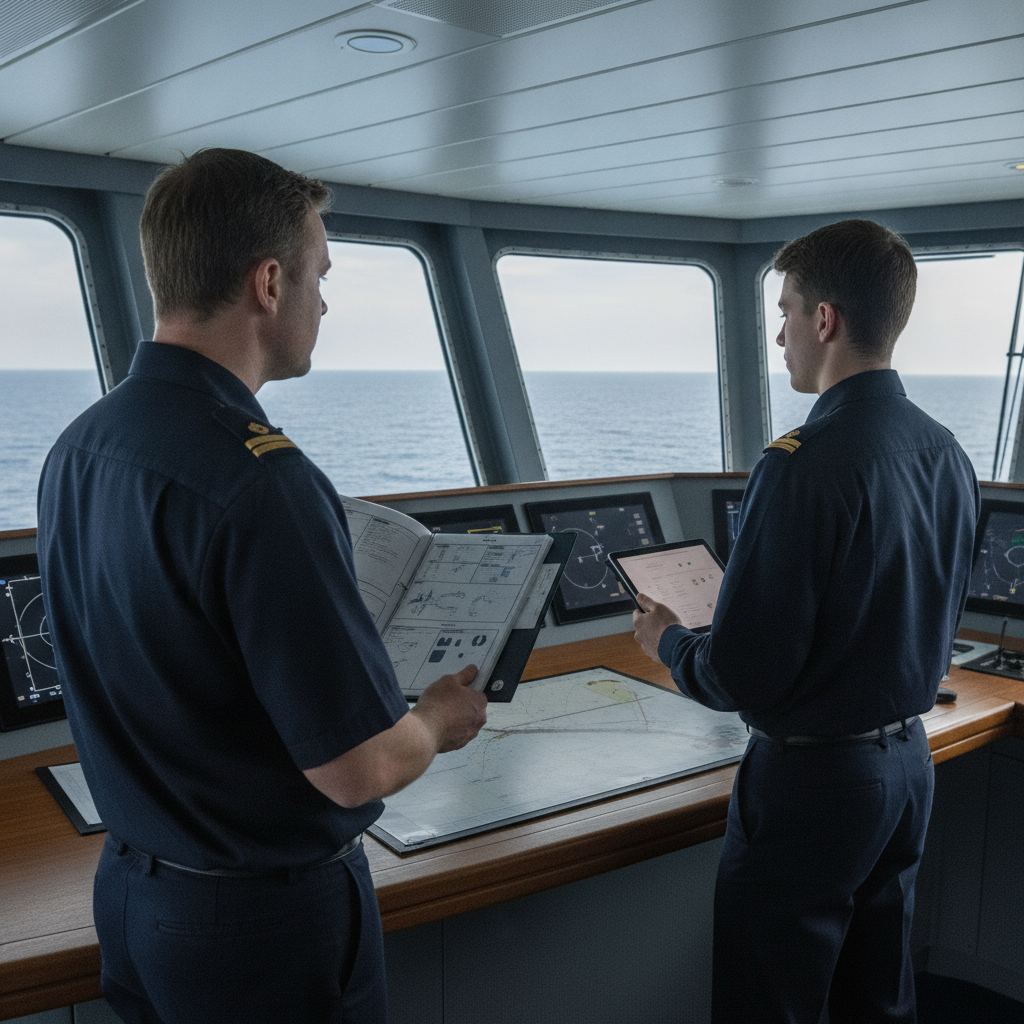
At its core, vessel performance monitoring software answers a deceptively simple question: is this ship performing as well as it should, right now, given the conditions it is operating in? Answering it well requires three things working together. First, reliable data on speed, power, fuel consumption, draught, trim, and the weather and sea state the vessel is experiencing. Second, a model of expected performance, usually built from sea trials, the shop test of the main engine, and a baseline period of clean-hull operation. Third, the analytical layer that compares actual against expected, corrects for conditions, and surfaces the deviation as something a human can act on.
Done properly, this transforms a fleet from reactive to proactive. Instead of discovering that a vessel has been burning extra fuel for months only when the accounts are reconciled, the technical team sees the trend emerging in near real time and can investigate while the cause is still cheap to fix. The same data layer feeds charter-party performance claims, voyage optimisation, maintenance planning, and emissions reporting, which is why performance monitoring increasingly sits at the centre of a unified maritime ERP rather than in an isolated spreadsheet.
Data Sources: Noon Reports Versus High-Frequency Sensors
The quality of any performance insight is capped by the quality of the underlying data, and this is where most monitoring programmes either succeed or quietly fail. Two broad data regimes exist, and most fleets operate somewhere between them.
Noon reports are the traditional source: a once-daily, manually compiled summary of distance, average speed, fuel consumed, weather observed, and engine parameters. They are universal, cheap, and require no new hardware, but they are coarse. A single daily average hides the speed and weather variation across twenty-four hours, manual entry introduces error, and the small sample size means it can take weeks of data to detect a real performance change with confidence. Noon reports remain valuable, especially across a large fleet, but they are a blunt instrument.
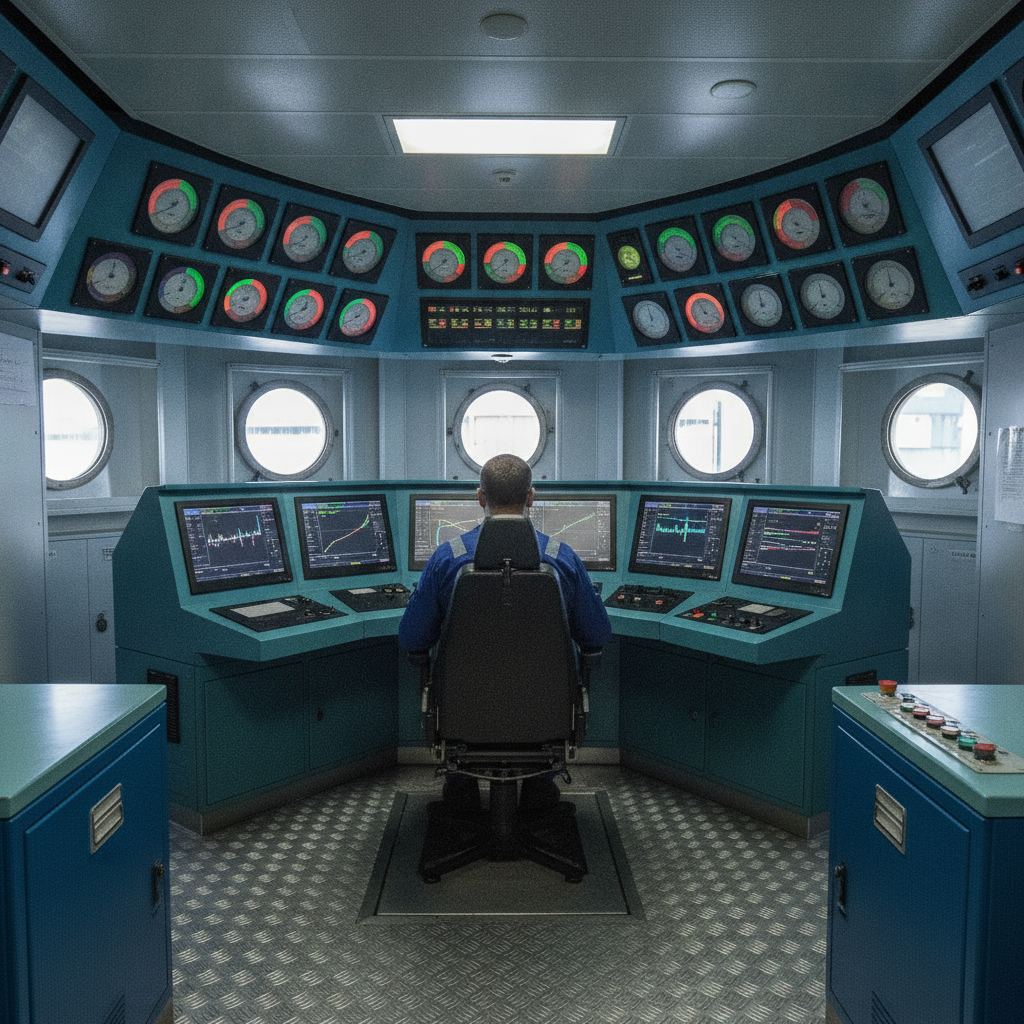
High-frequency sensor data, also called continuous or auto-logging, is the modern alternative. Flow meters, torque meters on the shaft, speed-through-water logs, and automated weather feeds record values every few seconds or minutes. This produces orders of magnitude more data points, allows genuine analysis of how the vessel behaves across the full operating envelope, and detects changes far faster. The trade-off is cost, installation, and a new problem: data quality at scale.
The Data Quality Problem Nobody Warns You About
More data is not automatically better data. High-frequency feeds are prone to sensor drift, calibration error, dropouts, and outliers that, if left unfiltered, produce confident but wrong conclusions. A speed log fouled by marine growth will under-read; a fuel flow meter out of calibration will quietly bias every consumption figure; GPS speed-over-ground mixed carelessly with speed-through-water will corrupt any hull analysis because it ignores current.
Good vessel performance monitoring software treats data validation as a first-class function, not an afterthought. It cross-checks sources, flags physically impossible values, filters periods of manoeuvring or shallow water, and is explicit about confidence. The most useful systems tell you not just what the performance is but how much to trust the number.
The most expensive mistake in performance monitoring is acting confidently on bad data. A clean, well-validated noon-report programme will beat a poorly filtered sensor feed every time.
The Analyses That Matter
Raw data becomes value through a handful of well-defined analyses. The first is the speed-consumption curve, the relationship between speed and fuel burn at a given draught and condition. This curve underpins voyage planning, bunker budgeting, and crucially the verification of charter-party speed and consumption warranties. When a charterer alleges underperformance, a defensible speed-consumption analysis corrected for weather is the difference between paying a claim and rebutting it.
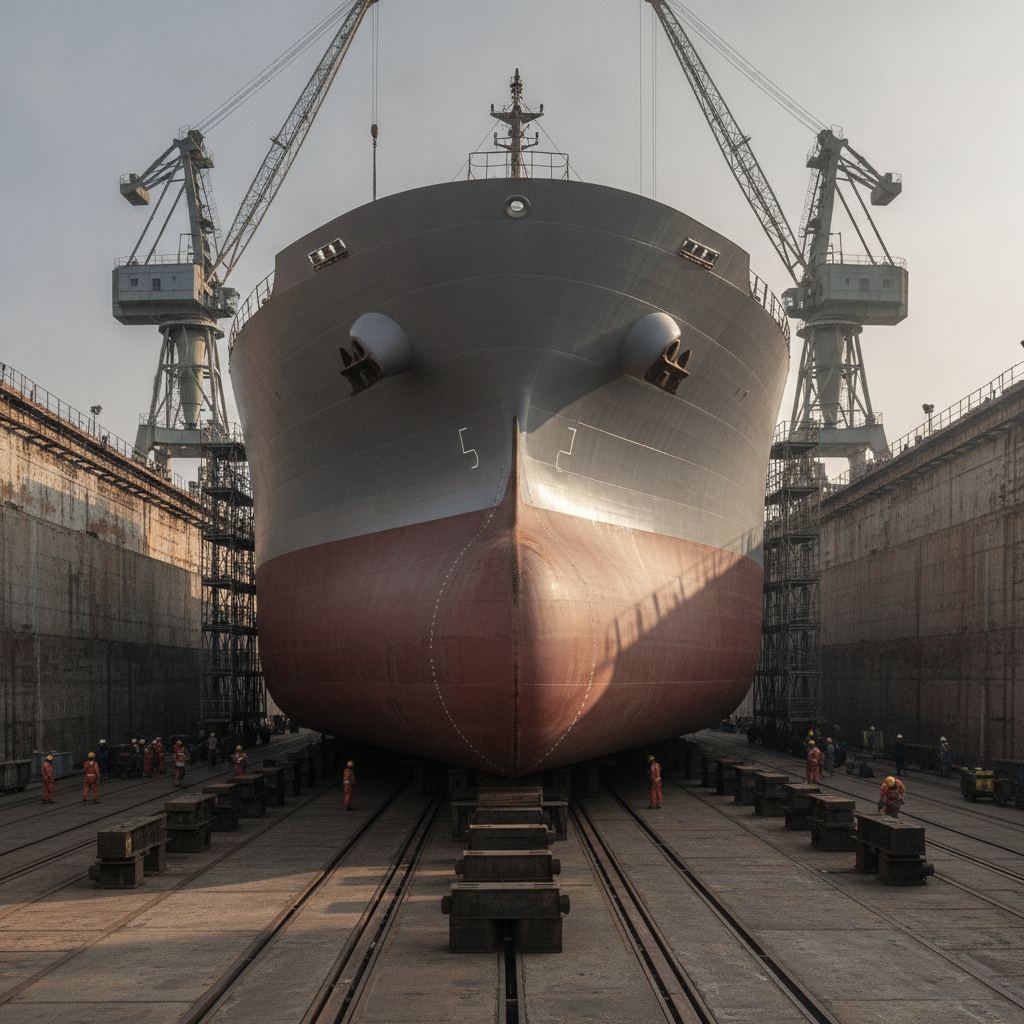
Second is hull and propeller performance, the detection of fouling. As biofouling accumulates on the hull and roughens the propeller, the power required to maintain a given speed rises. By tracking this added resistance over time, separated from weather and loading effects, the software shows the fouling penalty growing and pinpoints the economic moment to clean the hull or polish the propeller. The international reference here is ISO 19030, which defines a standardised methodology for measuring changes in hull and propeller performance so that results are comparable across vessels and over time.
Third is engine performance: tracking specific fuel oil consumption, exhaust temperatures, turbocharger condition, and cylinder balance against the shop-test baseline to catch tuning drift, fouling, or component wear before it becomes a failure. Fourth, and underpinning all of these, is weather correction and normalisation. A vessel slowed by a head sea is not underperforming; it is simply working against the environment. Normalisation strips out the effect of wind, waves, current, water depth, and loading so that what remains is the true technical condition of the ship. Without rigorous normalisation, every other analysis is noise.
Performance Is How You Actually Move Your CII
Regulation has made performance monitoring strategically essential. The IMO Carbon Intensity Indicator (CII) rates a ship on the carbon it emits per unit of transport work, and that rating depends directly on fuel burned over the year. EU MRV and IMO DCS already require verified fuel and emissions reporting; FuelEU Maritime adds a greenhouse-gas intensity limit on the energy used; and EEXI sets a technical efficiency floor for the existing fleet. Every one of these is, at bottom, a function of how efficiently the vessel converts fuel into distance.
The point operators sometimes miss is that compliance dashboards report the score, but performance management is how you change it. Reducing the hull fouling penalty, optimising trim, managing speed, and keeping the engine in tune are the levers that actually move a CII rating from D toward C, or protect a C from slipping. Treating reporting and performance as one continuous loop, rather than two separate exercises, is what separates fleets that merely comply from fleets that improve. For a deeper look at how these regimes fit together, see our guide to maritime decarbonisation software for CII, EEXI and FuelEU.
Turning Insight Into Action
Insight that does not change a decision is just an expensive chart. The value of vessel performance monitoring software is realised at the moment a finding triggers an action, and there are four recurring actions worth designing the whole system around.
- Hull and propeller cleaning timing. Instead of cleaning on a fixed calendar, the fouling trend tells you when the accumulated fuel penalty has crossed the cost of cleaning, so each intervention pays for itself.
- Trim optimisation. Small changes in trim can meaningfully change resistance. Performance data identifies the optimum trim for each speed and loading combination, often delivering savings with no capital cost at all.
- Speed and power management. Because fuel consumption rises sharply with speed, even modest, well-planned speed adjustments across a voyage can cut consumption substantially while still meeting the schedule.
- Condition-based maintenance. Engine and machinery trends flag developing problems early, shifting maintenance from calendar-based to condition-based and avoiding both unexpected failures and unnecessary overhauls.
The common thread is that each action is triggered by validated, normalised data rather than habit. Predictive and condition-based maintenance in particular has a strong, quantifiable payback when grounded in performance data; we explore the economics in our predictive maintenance ROI framework for shipping.
The Return on Investment
Performance monitoring is one of the rare maritime investments whose business case is straightforward, because the savings show up directly in the fuel ledger. Even small percentage improvements in efficiency, applied across a vessel's annual fuel spend, typically dwarf the cost of the software and the sensors. Hull cleaning timed by data rather than by calendar avoids both wasted cleanings and prolonged fouling penalties. Trim optimisation often delivers savings at effectively zero capital cost. Charter-party claim defence can recover or avoid sums that on their own justify a programme.
Beyond fuel, there is the avoided cost of a poor carbon rating, which can affect charter attractiveness and financing, and the avoided cost of unplanned machinery failure. The payback period for a well-run programme is usually measured in months rather than years, which is why performance monitoring is one of the first digital investments most serious operators make.
Integration With Voyage, Fuel and Maintenance Data
Performance data is at its weakest in isolation and at its strongest when connected. The speed-consumption model that comes out of performance monitoring is exactly what voyage planning and weather routing need to choose the optimum route and speed. The validated consumption figures feed fuel and bunker management directly. The machinery condition trends feed the maintenance scheduling system. And all of it feeds emissions reporting with consistent, auditable numbers.
When these functions live in separate, disconnected tools, data is re-keyed, definitions diverge, and the same fuel figure ends up different in three systems. When they share one platform, the performance model improves voyage decisions, voyage outcomes refine the performance model, and the whole fleet operates on a single source of truth. That integration is the real prize, and it is why fuel-efficiency software is increasingly bought as part of a wider fleet-management suite rather than as a point solution.
Choosing Vessel Performance Monitoring Software
When evaluating options, look past the dashboard demo and interrogate the fundamentals. Does the system handle both noon reports and high-frequency data, so you are not locked into one regime? How rigorous is its data validation and weather normalisation, and is it transparent about confidence? Does it implement a recognised methodology such as ISO 19030 for hull and propeller performance? Can it produce defensible charter-party analyses?
Equally important is fit with the rest of your operation. Does the performance module connect to voyage planning, fuel management, maintenance, and regulatory reporting, or will it become another island of data? Can it scale across a mixed fleet? And does the vendor understand commercial maritime operations, not just data science? The best tool is the one that turns data into decisions your teams will actually take, embedded in the systems they already use.
Frequently Asked Questions
What is the difference between noon reports and high-frequency monitoring?
Noon reports are a single manual daily summary; they are universal and cheap but coarse and slow to detect change. High-frequency monitoring uses automated sensors logging values every few seconds or minutes, giving far more detail and faster detection at the cost of hardware and a greater need for data validation. Many fleets use both, and good software handles either.
What is ISO 19030 and why does it matter?
ISO 19030 is the international standard that defines a consistent methodology for measuring changes in hull and propeller performance over time. It matters because it makes fouling and efficiency results comparable across vessels and across periods, so decisions about hull cleaning and propeller polishing rest on a defensible, standardised basis rather than ad hoc calculation.
How does performance monitoring help with CII and FuelEU compliance?
Compliance ratings such as CII, and the limits under FuelEU Maritime, EU MRV, IMO DCS and EEXI, are all driven by how much fuel a vessel burns to do its work. Performance monitoring identifies and quantifies the inefficiencies, such as hull fouling or poor trim, that you can act on to reduce fuel burn and therefore improve the rating. Reporting shows the score; performance management changes it.
Is vessel performance monitoring software worth it for a small fleet?
Yes. Because the savings come directly from reduced fuel consumption, the business case scales with fuel spend rather than fleet size. Even a small operator typically recovers the cost within months through better hull-cleaning timing, trim optimisation, speed management, and stronger charter-party positions, while gaining the data needed for regulatory reporting.
Can performance monitoring detect engine problems?
Yes. By tracking specific fuel oil consumption, exhaust temperatures, turbocharger behaviour and cylinder balance against the engine's baseline, the software flags tuning drift, fouling and component wear early, enabling condition-based maintenance before a small issue becomes a costly failure.
SupaMaritime brings vessel performance monitoring into a single commercial platform, with performance analytics, fuel management, voyage planning and maintenance scheduling sharing one validated source of truth. Explore the Merchant fleet-management module or browse all SupaMaritime modules to see how performance insight becomes fleet-wide action.